Household and Population Information (from Statistics Canada 2021 Census Data)
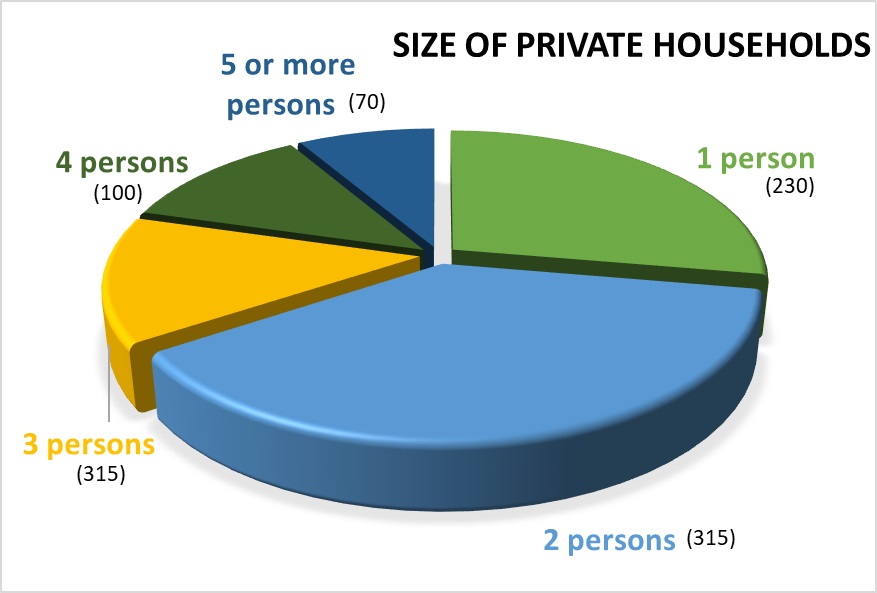
Most of the households in the Village of Lumby are two or three person households.
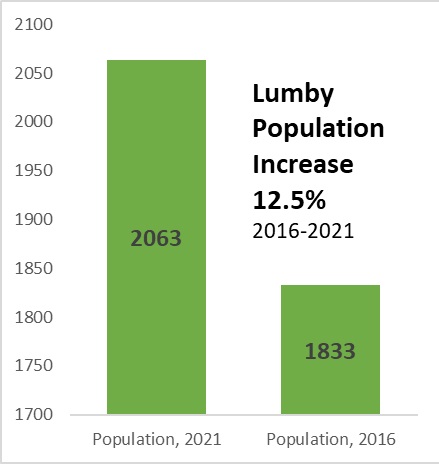
Canada Census: Population
2,063 (2021)
1,833 (2016)
12.5% increase over the 5 years 2016-2021.
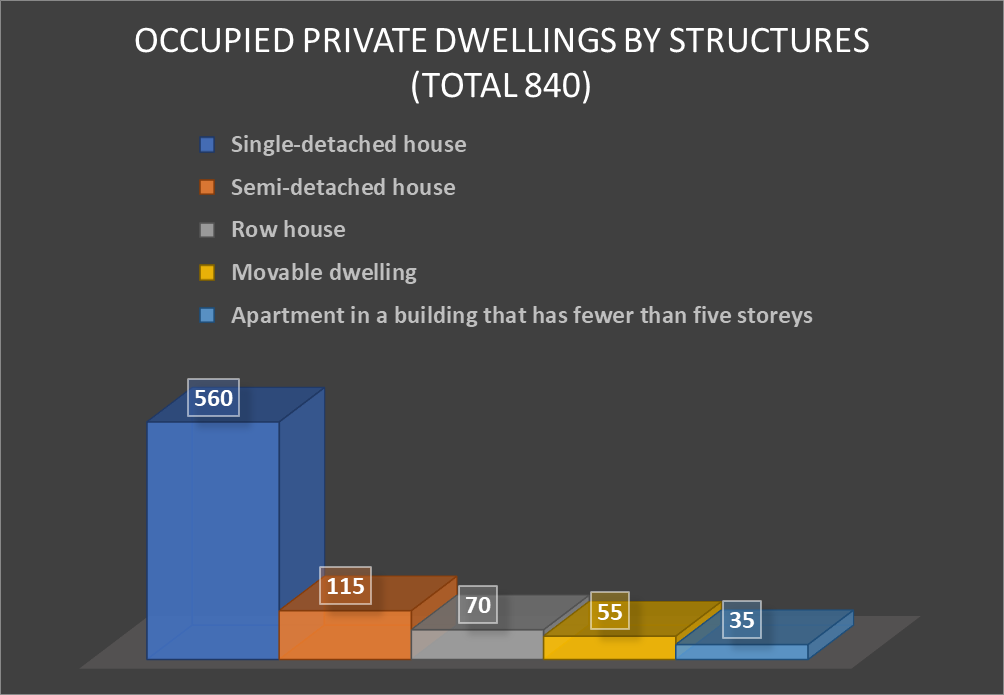
Most of the dwelling types in the Village of Lumby are Single-Detached homes. There is a need for more housing of all types within the Village and surrounding area.
Developers interested in our community can learn more by reading the Housing Needs Assessment Report.
Village of Lumby
Positive growth.
Lumby offers a variety of housing, employment and education options which makes our region an attractive place to live for many individuals, families, and retirees.
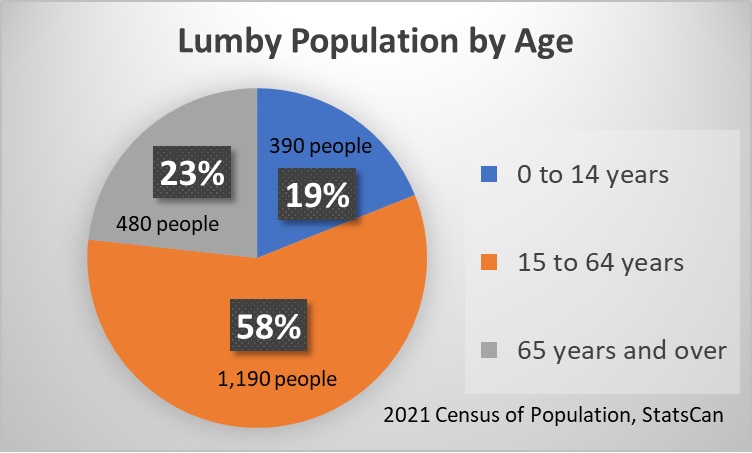
Our population is growing with demographics balanced among children, youth, working adults, and seniors. Lumby offers many recreational and social opportunities that appeal to all ages.
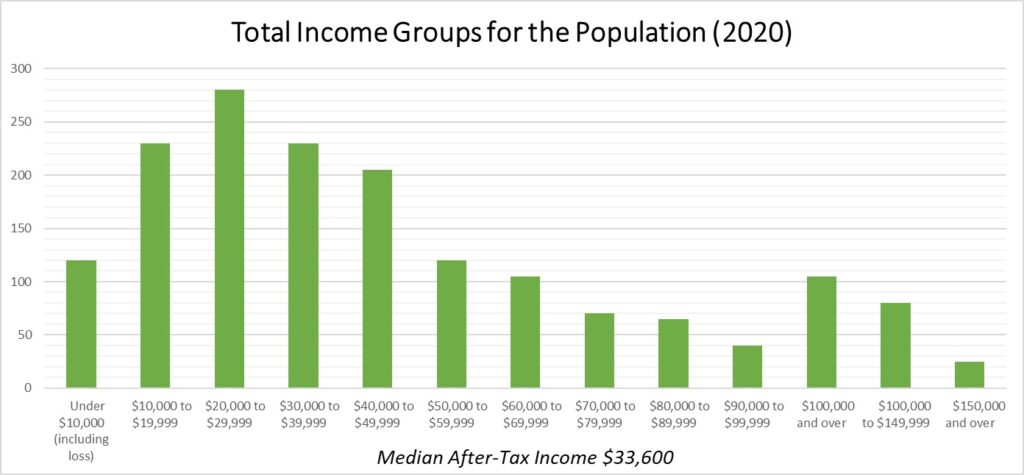
Our population also spans a wide section of income levels ranging from under $10,000 to over $150,000 per year. The median household income is $77,000, which is slightly higher than the provincial media.
Housing and Income Information

 Weather Facts:
| Elevation: | 495 m (1,625 ft.) |
| Hours of Sunshine: | 1,890 annually |
| Annual Rainfall: | 43.6 cm (17.2 in) |
| Annual Snowfall: | 143.2 cm. (47.9 in) |
| Average Growing Season: | 141 days |
Average Daily High and Low Temperatures Comparing Vancouver and Lumby
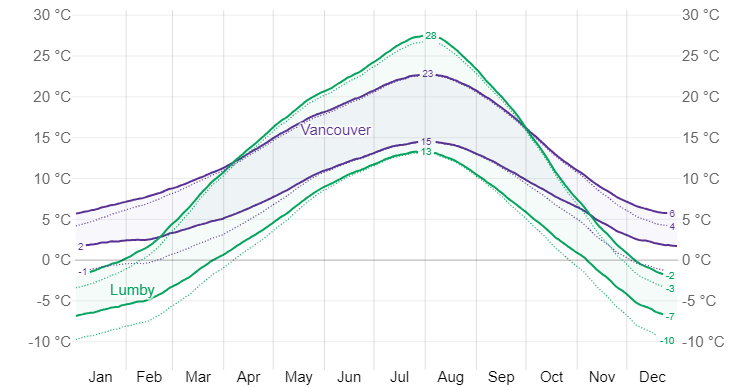
Average Daily Temperatures Celsius (Fahrenheit)
| January | – 4.9 c | (23.2) |
| February | – 2.2 c | (28.0) |
| March | 2.3 c | (36.1) |
| April | 7.4 c | (45.3) |
| May | 11.6 c | (52.9) |
| June | 15.3 c | (60.0) |
| July | 17.9 c | (64.2) |
| August | 17.6 c | (63.7) |
| September | 12.8 c | (55.0) |
| October | 6.2 c | (43.2) |
| November | 0.2 c | (32.4) |
| December | – 4.2 c | (24.4) |
Assessments and Taxes:
The assessment system used in the Province of British Columbia is under Provincial jurisdiction and is carried out by the BC Assessment. The system used is the market value method.

